The Monitoring Hub is a centralized dashboard showing recent Run Executions from all monitored Runs across all Projects. Add your critical production Runs once and you have a single place to check pipeline health - without navigating into each Knowledge Base individually.
Problem Overview
As the number of Projects, Knowledge Bases, and production pipelines grows, checking execution health individually becomes impractical. A team managing ten production Runs across five Projects would need to open each Knowledge Base, navigate to the Runs tab, and check execution results one by one. Failures that occur outside business hours go unnoticed until the next manual check - or until downstream users report the problem.
Solution
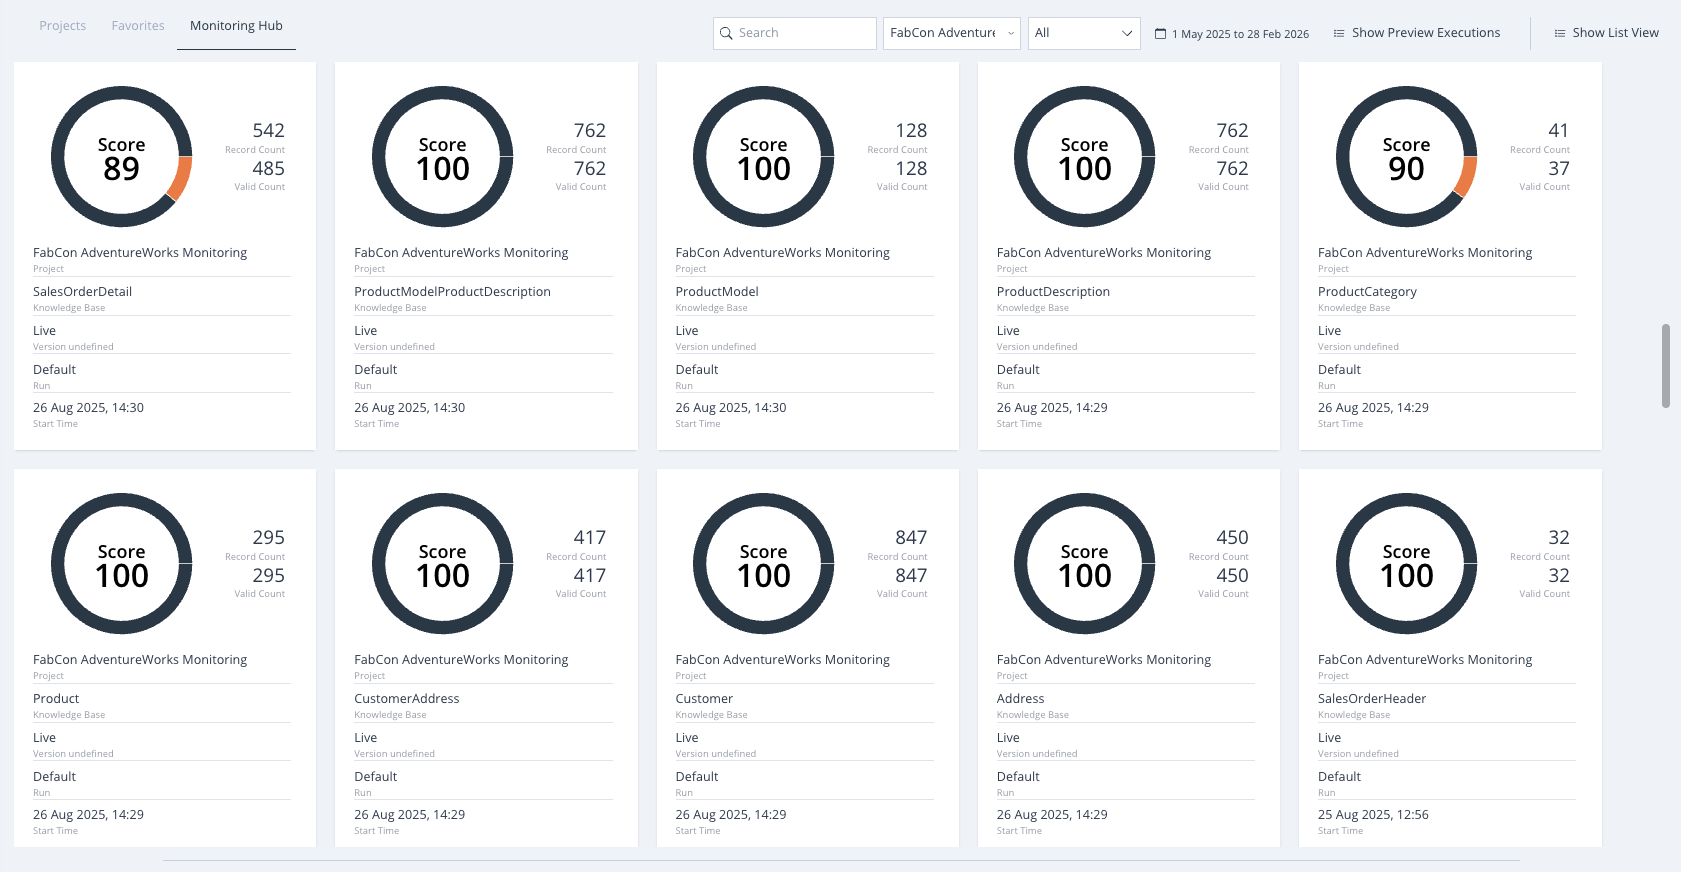
The Monitoring Hub aggregates recent Executions from all Runs that have been flagged for monitoring, presenting them in a single list ordered by most recent. Each entry shows the Project, Knowledge Base, Run name, and execution result summary. Clicking any entry opens the full Execution statistics drawer - the same detail view available within the Run itself - without navigating away from the hub.
The hub respects Project-level permissions: you only see Executions from Projects you have access to. By default, the last 7 days of executions are shown. The date picker extends this window, and a filter option can reveal Preview Executions if needed.
The Monitoring Hub is most effective when combined with the Events system: Events send immediate push notifications when something fails, and the Monitoring Hub provides the historical context to determine whether a failure is isolated or part of a recurring pattern.
Configuration
- Navigate to the Knowledge Base containing a Run you want to monitor
- Open the Runs tab and select the Run
- On the Run Detail page, enable the monitoring toggle
- Repeat for each critical Run across any Projects
- Access the Monitoring Hub from the Homepage by clicking the Monitoring Hub tab next to Projects and Favorites
Outcome
The Monitoring Hub's filter bar lets you narrow results by Project name, Knowledge Base name, or Run name. Hovering over any of these names in the list reveals a quick search icon - clicking it sets the filter to that value instantly, making it fast to focus on a single pipeline when an alert arrives. Hovering over the execution result indicators in the list also reveals detailed tooltips before you click through to the full statistics view.
If you have any further questions, please feel free to Contact Us.
Was this article helpful?
That’s Great!
Thank you for your feedback
Sorry! We couldn't be helpful
Thank you for your feedback
Feedback sent
We appreciate your effort and will try to fix the article